Pipeline Conversion Benchmarks for SaaS Sales Teams
Pipeline Conversion Benchmarks for SaaS Sales Teams
Want to improve your SaaS sales pipeline? Start by understanding conversion benchmarks.
From website visitors to paying customers, each stage of the funnel has specific conversion rates you should aim for. Here’s a quick breakdown:
- Visitor-to-lead rates: Average 1.5–2.5%, with top performers hitting 8–15%.
- MQL-to-SQL rates: Typically 32–40%, but can drop below 15% if lead scoring or follow-up is weak.
- SQL-to-Close rates: Average 20–25%, with elite teams exceeding 30%.
Key insights:
- Fast follow-ups matter: Responding to leads within an hour boosts conversions up to 7x. This is especially true when implementing SaaS partner enablement strategies to align external sales teams.
- Channel quality varies: SEO leads convert to SQLs at 51%, while PPC lags at 26%.
- Pipeline velocity impacts revenue: Shorter sales cycles (46–75 days) and faster responses drive higher ARR.
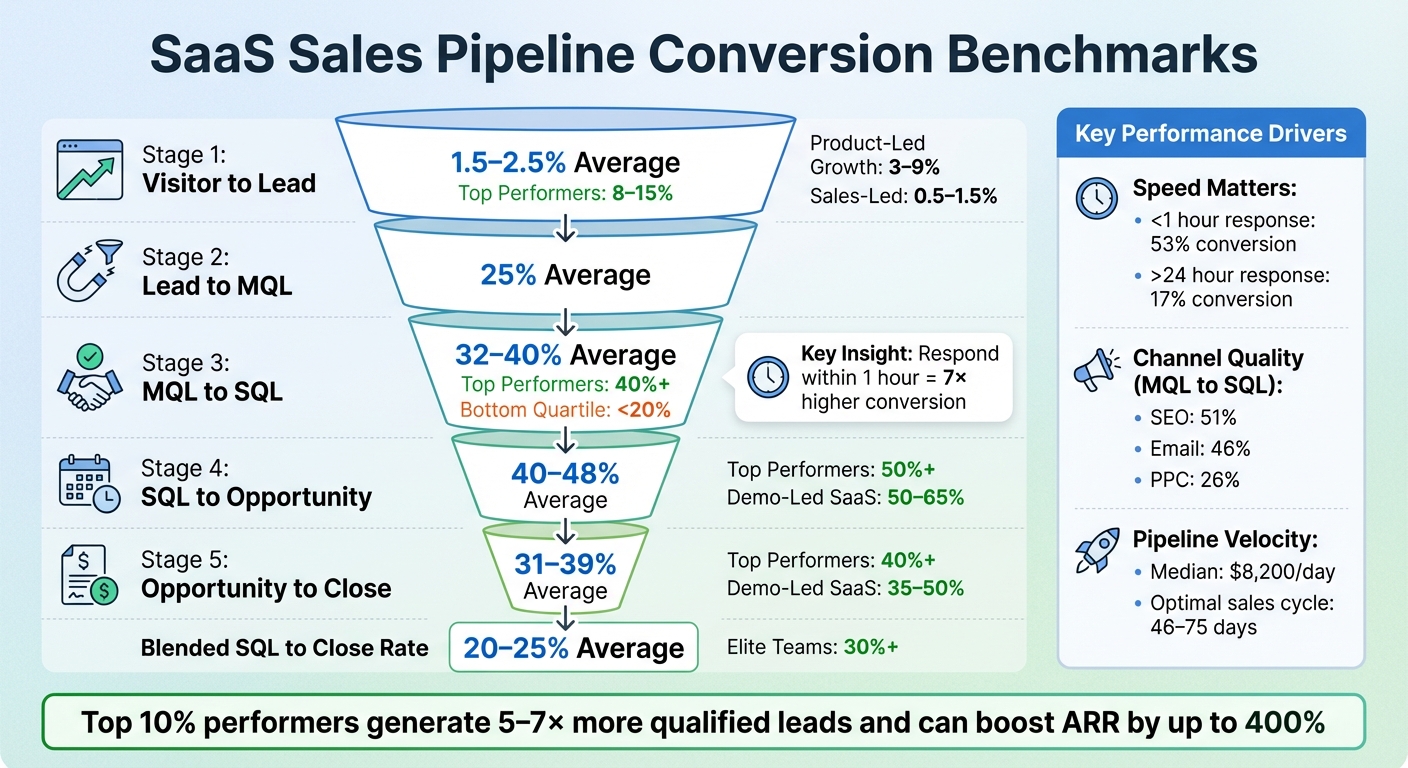
SaaS Sales Pipeline Conversion Benchmarks by Funnel Stage
SaaS Pipeline Metrics You Should Be Tracking in 2024
Visitor-to-Lead Conversion Rates
On average, B2B SaaS websites convert about 1.5% to 2.5% of visitors into leads, but the top 10% of performers achieve an impressive 8% to 15% conversion rate. That means these high achievers generate five to seven times more qualified leads than the average site.
"The average B2B website turns just 1.5% of visitors into leads. Top performers reach 8 to 15%. That gap is not a small tweak. It is a business-changing difference." - Henry, ConversionXperts
Product-led growth (PLG) models, which often include low-barrier entry points like free trials, tend to convert visitors at rates between 3% and 9%, while sales-led models lag behind at 0.5% to 1.5%. For trials requiring a credit card, conversion rates can jump to 20%–25%, while freemium models typically hover between 0.7% and 2.0%. Even company size plays a role - SaaS products aimed at small and medium-sized businesses (SMBs) convert at an average of 2.3%, compared to just 0.7% for enterprise-focused solutions.
The stakes are high. Falling into the bottom quartile with conversion rates below 0.7% can result in losing up to 60% of your ARR potential, while being in the top 10% could boost ARR by as much as 400%. For example, in 2025, transportation software company TripMaster achieved a 20% conversion rate from paid search campaigns, adding $504,758 in net new ARR in just 12 months by leveraging competitor conquesting and optimizing conversion strategies.
Simple changes can lead to big wins. For instance:
- Reducing form fields by 40% can increase conversions by 30%–50%.
- Adding testimonials near CTAs can boost conversions by 84%–270%.
- Single-goal landing pages convert at 13.5%, compared to 10.5% for pages with multiple CTAs.
- Mobile sites that load in under three seconds can prevent a 20% loss in conversions.
How Different Channels Affect Conversion
The channel you use to attract visitors also plays a big role in conversion rates. Webinars and events lead the pack with conversion rates between 5% and 10%, signaling strong buyer intent. Organic search (SEO) follows closely, converting visitors at 2.1% to 5.0%, as these users are often actively researching solutions. LinkedIn Ads see conversion rates of 2.0% to 6.0%, while PPC campaigns range from 0.7% to 4.5%. Referral and partner channels also perform well, converting at 3.0% to 8.0%.
The quality of leads varies by channel too. For instance, leads from SEO tend to have a 51% MQL-to-SQL conversion rate, compared to just 26% for PPC-generated leads. Companies like Playvox have shown the power of refining these strategies, cutting their cost per lead by 90% while increasing lead volume by 163%. Similarly, TestGorilla added 5,000 new customers during their $70M Series A phase.
"Most teams see stronger ROI when they improve conversion before scaling volume." - Aaron Rovner, CEO, SaaSHero
Aligning your channel strategy with your business model is critical. For instance, PLG companies often thrive with high-volume, lower-intent channels like paid search, while sales-led models benefit more from high-intent channels such as webinars and organic search.
Mastering these first steps in the conversion funnel lays the groundwork for evaluating later stages like MQL, SQL, and opportunity metrics.
Lead-to-MQL and MQL-to-SQL Conversion Rates
When it comes to lead conversions, the numbers tell a compelling story. About 25% of leads progress to MQLs (Marketing Qualified Leads), and from there, 32% to 40% advance to SQLs (Sales Qualified Leads). Broader B2B data shows conversion rates ranging from 11% to 39%, depending on factors like the company and the year. For B2B SaaS companies, the same 32% to 40% range is typical at the MQL-to-SQL stage, with top-performing companies hitting those benchmarks, while the bottom quartile lags behind at less than 20%.
Interestingly, mid-market and large enterprises hover around a 39% MQL-to-SQL conversion rate, though enterprise-level deals tend to involve more complex buying processes. In contrast, product-led growth models experience lower conversion rates - typically 15% to 30% for Product Qualified Leads (PQLs). However, PQLs often move through the pipeline more quickly since they’re based on actual product usage rather than marketing signals.
Timing is everything. Responding to high-intent MQLs within the first hour can boost conversion likelihood by up to 7x. Companies that respond quickly - within that golden hour - achieve a 53% conversion rate, compared to just 17% for those who wait more than 24 hours. Tools like AI-driven lead scoring can speed up qualification by 20% to 30%, while behavioral scoring models that monitor in-app engagement consistently outperform those relying solely on demographic data.
The quality of the lead source also plays a major role. For example:
- SEO-generated MQLs convert to SQLs at 51%.
- PPC leads lag behind at 26%.
- Email marketing performs well at 46%.
- Webinars come in at 30%.
If your MQL-to-SQL conversion rate is below 10%, it’s likely a sign of deeper issues, such as poor lead scoring, an unclear ideal customer profile (ICP), or sluggish sales follow-up.
Fixing Common Qualification Problems
While these averages provide a benchmark, many companies struggle with common pitfalls that drag down their conversion rates. One of the biggest challenges is misalignment between marketing and sales on what qualifies as an MQL or SQL. To fix this, both teams should document and agree on shared definitions, ensuring no leads fall through the cracks.
Another major issue is timing gaps between marketing handoffs and sales follow-ups. Conversion rates drop by a staggering 67% if follow-up takes longer than five minutes. Automating response workflows and using scheduling tools can eliminate delays. Setting up clear Service Level Agreements (SLAs) between marketing and sales - covering response times, lead disposition rules, and feedback loops - can also help tighten the process.
Switching from static to behavioral scoring models is another way to improve results. By tracking in-app engagement and intent signals from third-party sources, companies can achieve conversion rates closer to those of top performers. Regularly auditing conversion rates and reallocating budgets toward high-intent channels like SEO and referrals can also make a big difference. Simplifying lead capture forms by removing unnecessary fields is another quick win that reduces friction while still collecting essential data.
On the sales side, representatives often get stuck focusing on surface-level symptoms instead of addressing the root causes of a buyer’s challenges. To overcome this, train your team to document the "cost of inaction" - helping buyers articulate the consequences of not solving their problem in their own words. This can help create urgency in the mid-funnel stage. Additionally, treat proposals as collaborative checkpoints rather than one-sided deliverables. This ensures both parties agree on success criteria before moving forward.
SQL-to-Opportunity and Opportunity-to-Close Conversion Rates
After understanding the MQL-to-SQL benchmarks, the later stages of the sales pipeline provide a clearer picture of overall performance. On average, SQL-to-Opportunity conversion rates range from 40% to 48%, with top-performing teams achieving 50% or more, while weaker teams fall below 30%. Moving to the final stage, Opportunity-to-Close rates typically fall between 31% and 39%, though the best companies exceed 40%. Combining these metrics, the blended SQL-to-Close rate averages 20% to 25%, with elite teams surpassing 30%. Now, let’s examine how company size plays a role in these rates.
Company size directly impacts conversion rates. For SMB and mid-market companies ($10M–$100M ARR), SQL-to-Opportunity conversions hover around 42%, with Opportunity-to-Close rates at 39%. In contrast, enterprise organizations ($1B+ ARR) experience lower rates - 36% for SQL-to-Opportunity and 31% for closing opportunities. These differences are often due to longer evaluation cycles and a higher number of decision-makers involved.
Your go-to-market strategy also affects conversion outcomes. Demo-led SaaS companies outperform others, converting SQLs to opportunities at 50% to 65% and closing at 35% to 50%. Sales-led models follow, with SQL-to-Opportunity rates of 35% to 50% and Opportunity-to-Close rates of 30% to 45%. Meanwhile, product-led growth (PLG) companies see SQL-to-Opportunity conversions between 45% and 60%, but their Opportunity-to-Close rates drop to 20% to 35%. This drop reflects the PLG model’s focus on high-volume, low-touch sales funnels.
Other factors, like channel source and demo quality, also influence conversion rates. Inbound leads perform best, converting SQLs to opportunities at 45% to 60% and closing at 30% to 40%. Outbound leads, on the other hand, lag behind with SQL-to-Opportunity rates of 30% to 45% and close rates of 18% to 30%. Demo quality is another critical element. Top-performing teams achieve demo-to-opportunity conversion rates above 90%. Using interactive demos can significantly boost close rates, reaching 38% - a 52% improvement over traditional screen-share presentations.
Lastly, conversion rates vary by industry. For example, professional services firms close opportunities at 28%, while healthcare and medtech achieve 25%, and marketing and advertising firms close at 24%. SaaS and technology companies average 22%, whereas financial services (18%) and real estate and construction (16%) face more challenging closing environments due to regulatory and procurement complexities.
Pipeline Velocity and Conversion Time Benchmarks
Pipeline velocity is all about how quickly revenue moves through your sales funnel. The formula? (Number of Opportunities × Average Deal Size × Win Rate) / Sales Cycle Days. For B2B SaaS companies, the median pipeline velocity clocks in at $8,200 per day, or about $3 million annually. Top-performing teams, however, achieve 2.5× the velocity of those in the bottom quartile.
The size of your company plays a major role in velocity. Here’s how it typically breaks down:
- SMBs (Annual Contract Value under $15,000): $4,500 to $7,000 daily
- Mid-market firms ($15,000 to $100,000 ACV): $12,000 to $18,000 daily
- Enterprise organizations (over $100,000 ACV): $25,000 to $50,000 daily
Tracking your pipeline weekly can make a big difference. Teams that do this see 87% forecast accuracy and 34% annual revenue growth, compared to just 52% accuracy and 11% growth for those who track sporadically. This highlights the importance of shortening your sales cycle to keep revenue flowing faster.
In fact, cutting down your sales cycle has a 28% impact, outperforming other factors like win rate (25%), opportunity count (24%), or deal size (23%). A great example? In October 2025, Sarah Chen, VP of Sales at CloudMetrics, reduced their average sales cycle from 45 days to 28 days by introducing free trials, self-serve demos, and automated onboarding. This not only sped things up but also raised their win rate from 22% to 31%.
However, some stages in the sales process are more prone to delays. The Proposal stage is a common bottleneck, with 32% of B2B deals stalling here. Financial services companies see an even higher stall rate at 38%. Deals that drag on for 1.5× the average stage duration rarely close, so aiming for a stall rate below 20% is key.
How to Speed Up Your Pipeline
Want to boost your pipeline velocity? Focus on targeted strategies to eliminate slowdowns. For starters, remove deals that have been stuck for more than 1.5× your average sales cycle - these deals only clutter your pipeline without contributing to revenue. Another effective approach is using Mutual Action Plans (MAPs) in enterprise sales. MAPs help align timelines and key decisions early, cutting down on delays later.
Shortening your Proof of Concept (PoC) process can also make a big impact. Aim for a 15- to 30-day PoC with one to three clear success criteria. For instance, in March 2026, DearDoc drastically reduced its sales cycle to just 30 to 45 minutes by offering Buy Now, Pay Later (BNPL) options. This allowed clients to pay monthly while the company received the full contract value upfront.
Multi-threading is another game-changer. Deals involving five or more contacts have a 30% win rate, compared to just 5% for single-threaded deals. This is especially important in industries like enterprise healthcare technology, where sales cycles often stretch over 13 months. Engaging 5 to 20 stakeholders early can help prevent stalls.
Speed also matters. Responding to leads within five minutes can increase conversion rates by 8 to 21×. A good example is Snyk, which tackled a high email bounce rate (35% to 40%) by implementing a seven-day data refresh cycle. This improved email accuracy to 98%, slashed bounces to under 5%, and created a 180% surge in AE-sourced pipeline, adding over 200 new opportunities monthly.
Finally, aim for a sweet spot in your sales cycle. A cycle lasting 46 to 75 days strikes the right balance, maintaining high velocity without compromising deal size or win rates. Shorter cycles often lead to smaller deals, while cycles longer than 120 days result in a 35% drop in velocity.
Conclusion
Keeping a close eye on pipeline conversion rates can help uncover where revenue is slipping through the cracks and guide you toward the right fixes. The best SaaS teams consistently outperform the average by several times at every stage of the funnel. This performance gap has a direct impact on annual recurring revenue (ARR) and underscores the importance of refining each step of the process.
"Your conversion rate isn't just a metric - it's the multiplier that turns marketing spend into revenue and growth into category leadership." – Pixelswithin
Instead of comparing your numbers to broad industry averages, focus on benchmarking against companies similar to yours. Start by tracking your current conversion rates and identifying the stage with the steepest drop-off. The MQL-to-SQL handoff is often a weak spot, with an average of 85% of leads falling off at this stage. Even minor improvements here can have a ripple effect across your entire funnel. For instance, increasing SQL-to-proposal conversions can significantly cut down the number of discovery calls required.
If you’re looking to supercharge your pipeline, consider getting help from experienced GTM leaders. Stackd offers SaaS professionals access to mentors who’ve built and fine-tuned sales systems at leading companies. They provide tailored one-on-one guidance, with biweekly 45-minute sessions starting at $60 per month, plus a free trial session to get you started.
FAQs
Which conversion rate should I fix first in my SaaS funnel?
To improve your conversion rate, start by addressing the stages where the biggest drop-offs happen - often at the top of the funnel. Making improvements in the early stages, such as visitor-to-lead or lead-to-MQL conversions, can deliver the most noticeable results.
For instance, SaaS websites typically see visitor-to-lead conversion rates hovering around 3-5%. By optimizing this critical step, you can dramatically grow your pipeline, opening up more opportunities to drive revenue.
How do I calculate pipeline velocity for my team?
To figure out pipeline velocity, apply this formula: Pipeline Velocity = (Number of Opportunities × Average Deal Size × Win Rate) ÷ Average Sales Cycle Length. This calculation helps you gauge how much potential revenue is flowing through your sales pipeline over a specific period - daily or monthly. It’s a great way to measure the efficiency and pace of your sales process.
What’s the fastest way to improve MQL-to-SQL conversion?
Want to improve your MQL-to-SQL conversion rate? The fastest way is to focus on quicker, more personalized follow-ups. Reaching out within the first hour can make a huge difference, especially when compared to the typical 42-hour response time many businesses take.
To make this happen, automation is your best friend. Streamlining handoffs and using AI tools to craft personalized messages ensures you're engaging leads quickly and effectively. This reduces delays and keeps the momentum going, giving you a much better shot at success.