
Top Metrics for ABM Campaign Testing
Top Metrics for ABM Campaign Testing
Account-Based Marketing (ABM) thrives on precise measurement and testing. Without tracking the right metrics, you risk wasting resources and missing opportunities. Here’s a quick breakdown of the most impactful ABM metrics:
- Target Account Engagement Score: Measures overall interest by combining actions like demo requests and event participation. Helps prioritize high-value accounts.
- Account Engagement Rate: Tracks the percentage of target accounts engaging with your campaigns. Indicates whether your strategy resonates with the right stakeholders.
- Marketing Qualified Accounts (MQA) Rate: Identifies accounts ready for sales outreach based on engagement thresholds. Directly tied to pipeline health.
- Pipeline Influence: Connects marketing efforts to deal progression, showing how ABM impacts sales velocity and win rates.
- Return on Investment (ROI): Calculates the financial return of ABM campaigns. A key metric for proving success to stakeholders.
- Customer Acquisition Cost (CAC): Evaluates the cost-efficiency of acquiring new accounts. Paired with CLV, it ensures spending aligns with long-term revenue.
- Incrementality Lift: Measures the direct impact of campaigns by comparing target accounts to a control group. Helps eliminate wasted spend.
- A/B Testing Conversion Rate: Optimizes specific tactics by comparing variations in messaging, visuals, and CTAs.
Why it matters: ABM delivers a 53% close rate (vs. 19% for other methods) and can boost revenue by 208%. Tracking these metrics ensures your campaigns are data-driven, targeted, and effective.
Account Based Marketing Metrics That Matter
1. Target Account Engagement Score
The Target Account Engagement Score combines various signals - like website visits, downloads, email clicks, and event participation - into a single metric that reflects an account’s overall interest. Unlike traditional lead scoring, which focuses on individual actions, this score evaluates the entire buying committee within an account.
Effectiveness in Measuring Engagement
What makes this score so effective is its weighted system. Actions like requesting a demo are assigned more weight compared to something like a simple website visit, as they indicate much stronger intent. For example, you might assign 1 point for a visit, 10 for a content download, 25 for attending a webinar, and 50 for a demo request. This prioritization ensures you’re focusing on high-value actions.
"Account-level engagement is a better indicator of potential buying activity than individual lead scores." - Chris Moody, Chief Evangelist, Marketing, Demandbase
By tracking engagement across multiple stakeholders within an account, this scoring system reflects the collaborative nature of B2B decision-making. It also helps identify gaps - like key decision-makers who haven’t interacted yet - by creating organizational heatmaps. This holistic view directly feeds into your pipeline strategy.
Impact on Pipeline Performance
Engagement scores act as a leading indicator for pipeline health, helping you spot accounts moving toward a purchase even before an opportunity is officially created. For instance, accounts in the top 25% of engagement experience 18% faster sales cycles, and ABM opportunities close at a rate of 53%, compared to just 19% for traditional approaches.
To make it actionable, group accounts by their "heat level":
- Cold: 0–25 points
- Warming: 26–50 points
- Hot: 51+ points
This segmentation allows sales teams to focus their efforts where they’ll have the most impact. If an account’s score suddenly spikes, that’s a clear buying signal - alert your sales team immediately.
Insight into Testing Optimization
Engagement scores aren’t just about pipeline health - they’re also a powerful tool for refining your testing strategies.
These scores reveal which content and tactics resonate most with your target accounts. For instance, tracking whether ROI calculators or white papers drive higher engagement can help you fine-tune your content strategy for different account tiers. It’s not just about how often accounts engage, but how deeply.
A/B testing also becomes more targeted. Experiment with headlines, calls-to-action, or visuals, and track which variations boost the engagement score the most. This creates a feedback loop where every test provides actionable insights into what works best for your audience.
2. Account Engagement Rate
Account Engagement Rate measures the percentage of target accounts actively engaging with your content or campaigns. The formula is simple: divide the number of engaged accounts by the total number of target accounts, then multiply by 100. For instance, if 45 out of 150 target accounts are engaging, your engagement rate is 30%.
Effectiveness in Measuring Engagement
This metric shifts the focus from individual leads to the entire buying committee, which is central to Account-Based Marketing (ABM). Since ABM targets multiple stakeholders within an account, tracking engagement at the account level offers a clearer view of buying intent. If your engagement rate falls below 30%, it could indicate that your messaging needs improvement or your targeting strategy is off track.
"A low engagement rate means your ABM strategy isn't resonating. A high rate indicates that your content, ads, and outreach efforts are working well." - Samruddhi, Alore
It's not just about how many accounts are engaging - it’s about who within those accounts is engaging. If you’re only reaching one persona and missing key decision-makers, your engagement rate might look decent on paper but won’t drive meaningful pipeline progress. Use organizational heatmaps to map out which roles and departments are interacting with your content. This can help pinpoint areas where engagement is lacking. By taking a more granular approach, you can better understand how engagement impacts your pipeline.
Impact on Pipeline Performance
Engagement rate acts as a leading indicator for success, especially in long enterprise sales cycles. It bridges the gap between initial awareness and actual pipeline creation. Accounts with high engagement often convert to opportunities three times faster than those with lower engagement.
Consider this: in 2024, LaunchDarkly’s team booked 45 enterprise meetings in just 60 days, exceeding their goal by 150%. Similarly, Snowflake reported that their ABM-engaged accounts achieved an 80% higher Average Contract Value compared to non-ABM accounts. These examples show how tracking engagement not only evaluates performance but also uncovers opportunities for fine-tuning your strategy.
Insight into Testing Optimization
Engagement rate can also serve as a diagnostic tool to evaluate whether your campaigns resonate with your Ideal Customer Profile. For example, if engagement is high but conversions are low, it could signal a disconnect. Perhaps your sales team needs smoother handoff processes, or your accounts might require additional nurturing before they’re ready for direct outreach.
To refine your approach, experiment with messaging and assign weighted values to different activities. For instance, prioritize actions like pricing page visits or demo requests over less impactful interactions, such as social media likes. This helps identify which tactics are driving meaningful engagement and moving accounts closer to conversion.
3. Marketing Qualified Accounts (MQA) Rate
The Marketing Qualified Accounts (MQA) Rate tracks the percentage of target accounts that meet a specific engagement threshold. This threshold is determined by a mix of factors, including how well the account matches your Ideal Customer Profile (ICP), intent signals, and key engagement activities. In simpler terms, it identifies which accounts are ready for sales outreach. To calculate this rate, divide the number of qualified accounts by the total number of target accounts. This metric combines qualitative insights with measurable data, making it a valuable tool for evaluating your sales pipeline.
Impact on Pipeline Performance
The MQA Rate is a powerful indicator of your pipeline’s overall health. If the number of MQAs drops, it could mean fewer opportunities and lower revenue in the coming quarters. In fact, 91% of companies report that account-based marketing (ABM) improves pipeline conversion rates. For example, Metadata.io has seen ABM contribute to 70% of their new business pipeline.
Since 94% of B2B buying decisions involve three or more stakeholders, monitoring engagement at the account level offers a more accurate view of buying readiness. Accounts targeted with ABM strategies tend to close at a much higher rate - 53% compared to just 19% for traditional demand generation methods. These insights are essential for refining and testing your strategies.
Insight into Testing Optimization
MQA rates also provide valuable feedback during campaign testing. A low rate can highlight issues such as messaging, content, or targeting that might not be resonating with your ICP. For example, you might set a qualification threshold like "ICP fit + (intent surge OR at least 2 high-intent page views within 14 days)". Using a control group of lookalike accounts can help you measure the incremental impact of your campaigns.
Breaking down MQA rates by account tiers can uncover patterns, such as whether personalized, high-touch strategies for Tier 1 accounts lead to better results. Additionally, tracking the time it takes for an account to move from targeting to qualification can help identify bottlenecks and allow for quick adjustments during a campaign.
4. Pipeline Influence
Impact on Pipeline Performance
Pipeline influence gives you a clear picture of how your Account-Based Marketing (ABM) efforts affect deal velocity, win rates, and average contract values. Unlike traditional lead-focused metrics, this approach directly ties marketing activities to closed deals.
Here’s a standout stat: accounts targeted with ABM strategies close at a rate of 53%, compared to just 19% for traditional methods. Even better, accounts in the top 25% of engagement see sales cycles that are 18% shorter. These numbers highlight how ABM can reshape sales outcomes and provide a solid foundation for evaluating campaign ROI.
Ability to Validate Campaign ROI
Pipeline influence also helps quantify "influenced revenue" - the value of deals where ABM played a role, even if it wasn’t the primary driver. This is especially useful for complex, long-cycle deals where marketing and sales efforts overlap.
"Marketing-Influenced Pipeline: Measures the amount of pipeline that can be directly attributed to marketing activities, demonstrating the impact of marketing efforts on revenue generation." - Chris Moody, Chief Evangelist, Marketing, Demandbase
By bridging the gap between lead generation and closed revenue, pipeline influence becomes a critical tool for proving the value of your campaigns.
Insight into Testing Optimization
With these insights in hand, you can fine-tune your strategies by calculating Pipeline Velocity using this formula:
(Opportunities × Average Deal Value × Win Rate) / Sales Cycle Length.
Additionally, track metrics like the Account Progression Rate, which follows accounts as they move from "engaged" to "opportunity." Don’t overlook Buying Committee Coverage either - higher coverage often leads to better close rates. These measurements can guide you toward more effective ABM strategies and improved outcomes.
5. Return on Investment (ROI)
Ability to Validate Campaign ROI
ROI is the backbone of proving ABM’s financial impact. The formula is straightforward: (Revenue Influenced – Total Program Cost) ÷ Total Program Cost × 100. To calculate ABM ROI, you’ll need to account for both direct costs (like ad spend and content creation) and indirect costs (such as sales team time and technology subscriptions).
Here’s a stat to consider: 76% of marketers report higher ROI with ABM compared to other strategies. The top-performing programs achieve a 7:1 ROI, with the average coming in at 3:1. For mature ABM initiatives, the revenue impact is 70% more likely to be substantial.
"Without ROI measurements, ABM campaigns end up being seen by leadership as a cost rather than a source of revenue." – Michael Warford, Content Writer and Marketing Specialist, Directive
These metrics not only showcase the financial results but also help refine and improve campaigns over time.
Insight into Testing Optimization
Taking a layered approach to ROI - evaluating performance at the program, tier, and tactic levels - can pinpoint opportunities to maximize returns. For instance, Snowflake discovered that ABM-engaged accounts delivered an 80% higher Average Contract Value compared to non-ABM accounts. Similarly, LaunchDarkly used ROI insights to secure 45 enterprise meetings in just 60 days, exceeding their campaign goal by 150%.
To get the full picture, track two types of ROI: one tied to pipeline influence (future potential revenue) and another based on closed revenue (immediate returns). A robust multi-touch attribution model can help you credit every interaction in the often lengthy B2B sales cycle. Collaborating with your finance team early in the process ensures your ROI calculations are solid before presenting them to executives.
6. Customer Acquisition Cost (CAC)
Understanding Campaign ROI
Customer Acquisition Cost (CAC) measures the total sales and marketing expenses required to bring in a new customer. It’s calculated by dividing your total sales and marketing costs by the number of new customers acquired. For B2B SaaS companies, the average CAC hovers around $205.
When paired with Customer Lifetime Value (CLV), CAC becomes a powerful tool to assess whether your acquisition costs are justified by long-term revenue. This is especially relevant for personalized Account-Based Marketing (ABM) campaigns, which often require higher upfront investment. By analyzing CAC alongside CLV, you can validate whether these targeted efforts deliver returns that match or exceed the initial spend.
"In ABM, tracking CAC helps you understand the efficiency of your targeted campaigns and ensures that the cost of acquiring high-value accounts aligns with their potential revenue." – Chris Moody, Chief Evangelist, Marketing, Demandbase
Influence on Pipeline Performance
CAC plays a crucial role in evaluating the effectiveness of ABM strategies, especially since these campaigns often involve significant investment in personalization. Monitoring CAC helps determine whether these higher costs are justified by improvements in pipeline quality. For instance, opportunities from accounts targeted with an account-based approach close at a rate of 53%, compared to just 19% for traditional demand generation methods.
A high CAC might indicate inefficiencies in your sales funnel or marketing tactics, while a lower CAC suggests more efficient growth. Spending on the wrong Ideal Customer Profile (ICP) can lead to wasted resources and inflated acquisition costs. By tracking CAC alongside metrics like pipeline velocity, you can uncover bottlenecks and rising costs, helping to refine and improve your ABM strategies.
Driving Testing and Optimization
Like other ABM metrics, CAC offers valuable insights for refining your budget and improving both engagement and conversion. Breaking down CAC by account tiers can help you evaluate whether higher spending on personalization yields better returns. For example, if Tier 1 accounts show a high CAC but don’t deliver larger deal sizes, this could signal the need to experiment with less resource-intensive strategies for that segment.
CAC also proves useful during A/B testing of ABM channels. Whether comparing LinkedIn ads to direct mail, CAC helps identify which channel delivers the best results for the cost. To ensure accuracy, focus only on top-of-funnel advertising costs when calculating CAC. This ensures the metric reflects acquisition expenses rather than retention efforts.
7. Incrementality Lift
Understanding Campaign ROI
Incrementality lift helps you measure the true, incremental impact of your ABM campaigns on business outcomes. Unlike traditional attribution models - which can inflate results by including conversions that would have happened anyway - incrementality lift focuses solely on conversions directly driven by your campaign efforts.
Here’s how it works: you set aside a control group (at least 10% of your target accounts) that doesn’t receive your campaign, then compare their conversion rate to the group that does. For instance, if your test group converts at 1.5% and your control group at 0.5%, your incrementality lift is 66.7%. This approach clearly identifies the conversions your campaign directly influenced. It’s a powerful way to fine-tune your strategy and improve your pipeline performance.
"Only incrementality can reveal which media investments contribute to business metrics and by how much." – Nick Stoltz, Chief Strategy Officer, Measured
Boosting Pipeline Efficiency
Incrementality testing helps eliminate wasted spending by identifying conversions that wouldn’t have happened without your campaign. This insight is particularly useful when presenting your case for budget increases to your CFO. Instead of relying on vague attribution numbers, you can show exactly how much net-new revenue your campaigns have generated.
It also highlights saturation points, where additional spending on certain accounts or channels stops producing meaningful growth.
"Our team has now fully embraced Measured's methodology and platform, driving smarter media investment choices and netting us big wins in incremental sales." – Rick Egan, VP Performance Marketing at Overstock.com
Optimizing Through Testing
Beyond budget efficiency, incrementality lift provides actionable insights for campaign adjustments. By running holdout tests, you can establish baseline conversion rates and shift resources from underperforming channels to those that deliver higher returns. Controlled testing and automated lift analysis make it easier to pivot quickly, ensuring your ABM efforts stay focused on the channels that truly deliver results.
8. A/B Testing Conversion Rate
Effectiveness in Measuring Engagement
A/B testing conversion rates is a powerful way to uncover which specific strategies drive account progress. Instead of relying on assumptions, this method provides concrete data by directly comparing personalized tactics. For example, testing variations in headlines, CTAs, or images can reveal which elements generate the most engagement.
By tracking conversion rates at various stages - such as moving accounts from "Engaged" to "Marketing Qualified Account" - you can pinpoint where momentum builds or stalls. This level of detail helps you understand how high-value accounts are advancing through the pipeline.
Impact on Pipeline Performance
Conversion rates are a direct measure of how effectively your tested strategies move high-value accounts closer to generating revenue. Segmenting A/B test results by account tier offers deeper insights, as converting a Tier 1 account often has a far greater impact than lower-tier accounts.
"ABM requires there to be critical mass at the account among the buying unit, versus regular marketing efforts where you may just need a single point of entry." – Mitchell Hanson, Senior Director of Demand Generation, ZoomInfo
If your data reveals a bottleneck - like a low conversion rate during the proposal stage - it’s a signal to refine your approach. This might mean providing better sales materials or tweaking your messaging to address objections.
Ability to Validate Campaign ROI
A/B testing conversion rates also helps prove the financial impact of your ABM efforts. By tracking conversion rates at each stage, you can quantify the financial return of specific tactics and identify which programs deserve more investment.
"ROI is a fundamental measure of the financial effectiveness of your ABM efforts. Positive ROI demonstrates that your strategies are yielding profitable returns, justifying the investment in ABM." – Jimit Mehta, ABMatic
Companies with structured ABM strategies experience a 208% revenue increase compared to those without. These insights not only justify your investment but also help you make mid-campaign adjustments to maximize performance.
Insight into Testing Optimization
Tracking conversion rates provides actionable insights for refining your campaigns in real time. If a tactic isn’t performing as expected, you can adjust your messaging or targeting based on immediate feedback. Multi-touch attribution models can also identify which touchpoints - whether emails, ads, or webinars - played the biggest role in driving conversions.
"A good metric changes behavior. When a metric is a simple number that causes changes in the bottom line, you can act on insights." – Chris Moody, Chief Evangelist, Demandbase
Focusing on conversion ratios instead of raw numbers offers a clearer picture of how different marketing elements interact. Setting baseline conversion rates before launching tests ensures you can accurately measure how quickly accounts move through the buying journey.
Metric Comparison Table
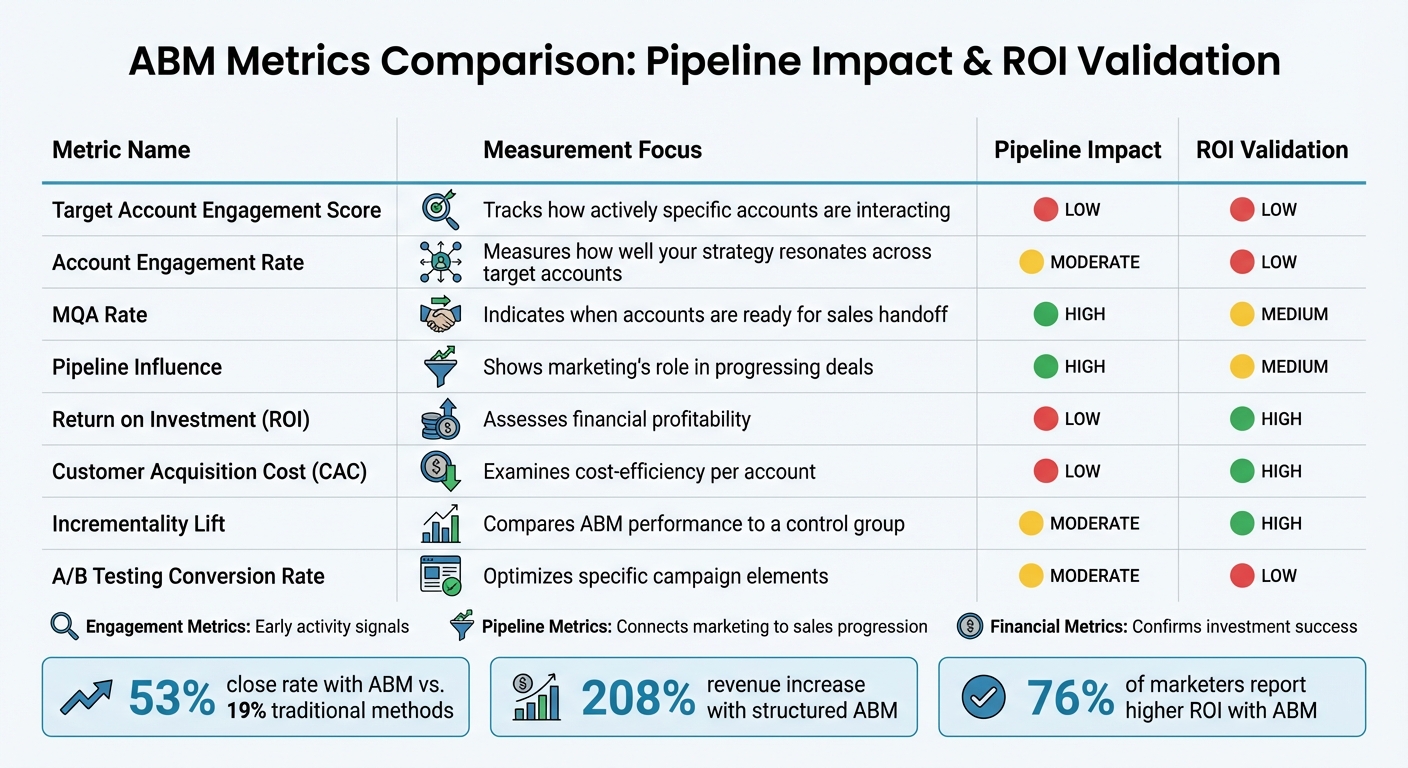
8 Essential ABM Metrics Comparison: Pipeline Impact and ROI Validation
To make sense of individual metric insights, this table lays out how different metrics play distinct roles in ABM campaign testing. Each metric serves a purpose, whether it’s predicting future success or validating financial outcomes. Knowing these differences helps you zero in on the metrics that align with your testing goals.
Here’s a quick comparison of each metric's focus, its impact on the sales pipeline, and its role in validating ROI:
| Metric | Measurement Focus | Pipeline Impact | ROI Validation |
|---|---|---|---|
| Target Account Engagement Score | Tracks how actively specific accounts are interacting | Early signal of interest | Low (indirectly linked) |
| Account Engagement Rate | Measures how well your strategy resonates across target accounts | Moderate (shows funnel health) | Low (evaluates overall strategy) |
| MQA Rate | Indicates when accounts are ready for sales handoff | High (feeds directly into opportunities) | Medium (closely tied to revenue) |
| Pipeline Influence | Shows marketing's role in progressing deals | High (tracks deal acceleration) | Medium (connects marketing to outcomes) |
| Return on Investment (ROI) | Assesses financial profitability | Low (lagging indicator) | High (key proof of financial success) |
| Customer Acquisition Cost (CAC) | Examines cost-efficiency per account | Low (focuses on process efficiency) | High (key for understanding profitability) |
| Incrementality Lift | Compares ABM performance to a control group | Moderate (validates strategic value) | High (proves unique impact) |
| A/B Testing Conversion Rate | Optimizes specific campaign elements | Moderate (improves conversion points) | Low (narrow tactical focus) |
Each metric fits into one of three categories: engagement metrics provide early activity signals, pipeline metrics connect marketing efforts to sales progression, and financial metrics confirm whether your investment paid off. Together, they help you make informed, data-driven adjustments throughout your campaign.
"ABM is about working smarter, not harder. When you focus on the right accounts (and the right metrics), you're already most of the way there." – Austin LaRoche, CEO, ATAK Interactive
When testing, align your metrics with your campaign stage. Engagement metrics are great for quick feedback, pipeline metrics show progress, and financial metrics give you the final word on success.
Conclusion
Measuring the right metrics turns ABM testing into a precise, data-driven process. It helps identify bottlenecks early and ensures resources are directed toward the accounts that matter most. By keeping an eye on engagement scores, pipeline influence, and ROI, you gain a clear understanding of what’s working and where adjustments are needed.
Here’s why it matters: ABM strategies have a 53% close rate, compared to just 19% with traditional methods, and they can boost revenue by as much as 208%. These impressive results stem from consistent tracking and making iterative changes based on actual performance data.
What sets ABM apart is its focus on quality over quantity. Instead of chasing raw lead numbers, ABM metrics emphasize deeper engagement, stronger relationships, and measurable revenue impact.
For those looking to refine their skills, personalized mentorship from seasoned Go-to-Market experts at Stackd can make a big difference. Whether you’re transitioning from lead-based to account-based strategies, developing complex scoring models, or tackling multi-touch attribution, having a mentor can help you apply these metrics effectively in real-world campaigns.
The key is to align your metrics with the stage of your campaign, track them consistently, and use the insights to make informed decisions. By doing so, you not only validate your ABM strategy but also set the stage for ongoing improvement and success.
FAQs
What are the key metrics to focus on at each stage of an ABM campaign?
To gauge the success of your ABM campaign, focus on metrics that match the buyer journey's different stages.
In the awareness stage, keep an eye on metrics like Account Engagement Scores - things like website visits, content downloads, or event participation - and content consumption, such as video views or whitepaper reads. These indicators show whether you're connecting with the right accounts and individuals.
As you move into the consideration stage, shift your focus to metrics that highlight influence and readiness. Track pipeline influence, which measures how many engaged contacts are progressing through the funnel, and account-fit scores, which combine engagement data with firmographic details to pinpoint high-potential accounts.
When accounts reach the decision stage, prioritize metrics that show conversion and revenue impact. These include pipeline velocity, opportunity creation, deal size, and ROI, all of which help you understand how quickly accounts are turning into revenue and the financial return of your efforts.
For personalized guidance on aligning these metrics with your goals, Stackd offers access to seasoned GTM mentors who can help you fine-tune your ABM strategy for measurable success.
What are the key signs that my ABM strategy needs improvement?
If your account-based marketing (ABM) strategy isn’t hitting the mark, there are a few critical metrics that can signal potential issues. For instance, a dip in account engagement, a slower pipeline velocity, or a drop in revenue attribution often suggests something’s off. Other red flags include poor account health scores, shrinking ROI, or declining engagement rates across the board.
Keeping a close eye on these numbers allows you to make timely adjustments, fine-tune your approach, and ensure your ABM strategy stays aligned with your business objectives.
What are the best ways to measure the ROI of my ABM campaigns?
To evaluate the ROI of your ABM campaigns, start by linking account-level activities directly to the revenue they generate. Set specific financial targets, such as aiming for $2 million in pipeline influence or boosting deal size by 20%. Next, tally up the total cost of your ABM efforts, factoring in expenses like data tools, content creation, advertising, and the time your team dedicates to the campaign. Use an attribution model to trace how individual touchpoints - like engagement clicks, booked meetings, and closed-won deals - contribute to revenue. Then, calculate ROI using this formula: (Revenue attributed to ABM – Total ABM Cost) ÷ Total ABM Cost × 100%.
Key metrics to monitor include:
- Engagement rates: How many target accounts are interacting with your content?
- Pipeline influence: The total value of opportunities involving accounts touched by ABM.
- Deal size growth: Are deals getting larger?
- Win-rate improvements: Are you closing more deals?
- Sales cycle duration: Is the time to close deals getting shorter?
Tracking these metrics at the account level gives you a clearer picture of how ABM contributes to qualified opportunities and revenue growth.
If you need expert guidance in creating a measurement strategy for ABM, consider reaching out to a Go-to-Market mentor on Stackd. They can help you identify the right metrics, align them with your objectives, and effectively communicate ROI insights to your leadership team.