How to Analyze SaaS Conversion Funnels
How to Analyze SaaS Conversion Funnels
Want to boost your SaaS revenue? Start by analyzing your conversion funnel. This process helps you identify where users drop off and why, so you can fix leaks and improve conversions. Here’s a quick guide to understanding and optimizing your funnel:
-
What is a SaaS Conversion Funnel?
It maps the customer journey from awareness to retention, focusing on stages like free trials, onboarding, and paid conversions. Unlike traditional sales funnels, SaaS funnels are cyclical, emphasizing long-term customer relationships. -
Why Funnel Analysis Matters:
- Predict revenue with up to 85% accuracy.
- Even a 1% conversion rate boost can increase annual revenue by 7%.
- Address weak points like trial-to-paid conversions, which average just 5-10% for many SaaS companies.
-
Steps to Analyze Your Funnel:
- Map each step of the user journey (e.g., Blog → Signup → Onboarding → Paid Conversion).
- Use tools like Google Analytics for traffic, Mixpanel for in-app behavior, and Hotjar for session insights.
- Measure key metrics: trial signups, activation rates, churn, and revenue.
- Identify bottlenecks using funnel visualizations and segment data by user type or acquisition channel.
-
Optimizing Your Funnel:
- Test changes like shorter forms, clearer CTAs, or better onboarding flows.
- Prioritize fixes with the most impact, such as improving trial-to-paid rates or reducing churn.
Funnel analysis isn’t just about tracking data - it’s about taking action to improve every stage of the customer journey. Start by mapping your funnel, tracking metrics, and testing improvements to drive growth.
SaaS Conversion Funnel Analysis: 4-Stage Framework with Key Metrics
SaaS Funnel Teardown: How to Analyze, Test, and Improve Every Stage of Your Customer Journey
How to Map Your Funnel and Collect Data
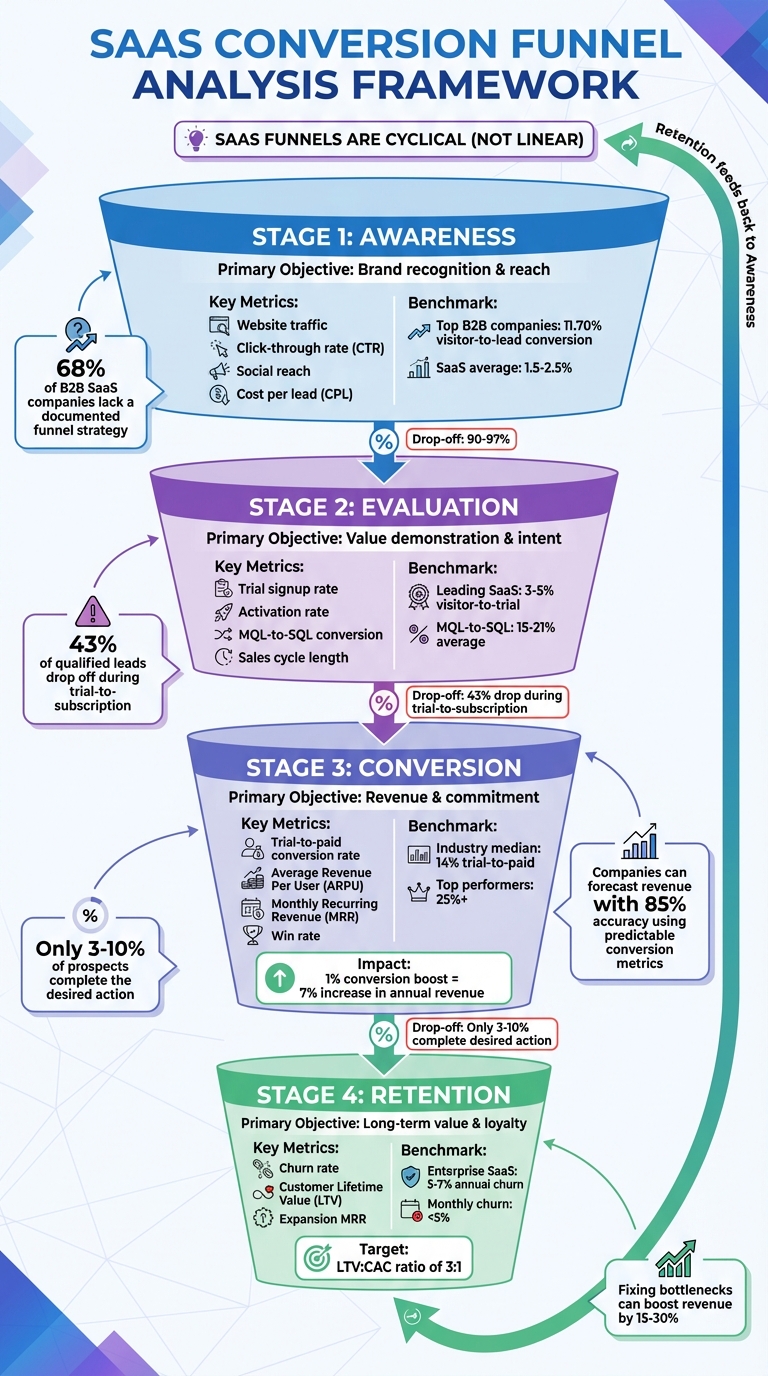
To effectively map your funnel, you need to document every step a user takes - from first discovering your product to becoming a paying customer. Surprisingly, 68% of B2B SaaS companies don't have a documented funnel optimization strategy. This lack of clarity often leaves businesses unaware of where they might be losing potential revenue.
Steps to Map the User Journey
The process starts with defining your primary goal. What action do you ultimately want users to take? For most SaaS companies, this could be a subscription purchase, a demo request, or a free trial signup. Once you’ve identified the end goal, work backward to pinpoint every interaction leading up to it.
Detailed user personas are essential here. These profiles should highlight user motivations, goals, and pain points, helping you understand what drives users through your funnel - or what might stop them. With this insight, you can assess metrics at each stage of the funnel more effectively.
Next, outline the main stages of your funnel to ensure consistent tracking: Awareness (top of funnel), Interest/Consideration (middle of funnel), Evaluation/Decision (bottom of funnel), and Purchase/Retention. For each stage, identify the key touchpoints. For example, a typical SaaS funnel might look like this: Blog → Signup → Email Verification → Onboarding → First "Aha Moment" → Paid Conversion.
It’s also critical to define what triggers movement between stages. Taylor Bartlett from Wonderflow emphasizes:
"If you can't define what makes an MQL an MQL, you can't optimize it".
Write a simple, one-sentence definition for each transition. For instance, a user might be considered "activated" when they complete their first successful run within seven days.
Finally, visualize your funnel using a flow diagram or funnel chart. This will make it easier to identify gaps and share the process with your team. Keep in mind that modern SaaS funnels are rarely linear. Users may switch devices, revisit earlier steps, or consume content in an unexpected order. Your map should reflect these non-linear behaviors.
Once your funnel is mapped, the next step is to select tools that transform these steps into actionable insights.
Tools for Tracking Funnel Data
After mapping your funnel, you’ll need tools to track user behavior across each stage. Most SaaS companies use a combination of platforms to get a complete picture.
Google Analytics 4 (GA4) is a go-to option for monitoring top-of-funnel activity. It tracks traffic sources, page views, and early conversions. While it’s excellent for tracking awareness-stage metrics, it’s less effective for in-app behavior.
For in-depth tracking of in-app events, product analytics tools like Mixpanel, Amplitude, and Userpilot are invaluable. These platforms monitor feature activation, trial progression, and the path from signup to paid conversion. Userpilot, for example, offers an easy-to-use event-tagging feature that doesn’t require developer assistance. Pricing for Userpilot starts at $299/month when billed annually.
To understand why users drop off, tools like Hotjar, FullStory, and VWO Insights combine data with session recordings and heatmaps. For example, fintech startup AstroPay used Smartlook in May 2022 to analyze session recordings of users abandoning their cryptocurrency purchase funnel. They discovered confusion around "pending" transaction states. By simplifying the process and adding a "Purchase pending" banner, they boosted conversions by 56%.
Platforms like Segment and RudderStack help manage identity stitching, enabling you to track users as they transition from anonymous visitors to logged-in accounts across devices.
Finally, CRM and automation tools such as HubSpot, Intercom, and Drift support lead nurturing and streamline sales handoffs.
"A funnel isn't something you choose to have. It already exists through every interaction someone has with your brand. Each touchpoint can either move people forward or create hidden revenue leaks."
– Alisha Conlin-Hurd, CEO & Co-Founder, Persuasion Experience
Before diving into analysis, make sure your tracking setup is accurate. Validate your instrumentation to ensure events don’t fire multiple times and that identity stitching correctly tracks users moving from anonymous to logged-in states. Fix any tracking issues immediately - decisions based on faulty data can be more damaging than working without data at all. A well-defined funnel map is the backbone of accurate data collection, so this step is non-negotiable for meaningful analysis.
Key Metrics to Measure at Each Funnel Stage
Once your funnel is mapped and tracking tools are in place, it's time to zero in on the key metrics for each stage: awareness (visibility), evaluation (engagement and intent), and conversion (revenue and loyalty). These metrics help you gauge success at every step and identify areas for improvement.
Awareness Metrics
At the top of the funnel, the aim is to attract attention and draw in the right audience. Here, visibility and engagement take center stage.
- Website traffic is a foundational metric, showing how many people are discovering your brand. But don’t stop at raw numbers - focus on organic traffic that aligns with your target audience.
- Click-through rate (CTR) measures how effective your messaging is across platforms like ads, emails, and search results. A low CTR could signal issues with your copy or targeting.
- Cost per lead (CPL) highlights the efficiency of your paid campaigns. For context, top-performing B2B companies boast visitor-to-lead conversion rates around 11.70%, while SaaS companies typically range between 1.5% and 2.5%. If you're falling short, your landing pages or lead magnets might need a closer look.
Once visibility is established, the next step is understanding user behavior and intent in the evaluation stage.
Evaluation and Decision Metrics
This is where potential customers actively consider your product and its ability to meet their needs. Metrics here focus on behaviors that indicate readiness to buy.
- Trial signup rate is essential for product-led growth models. Leading SaaS companies see visitor-to-trial conversion rates of 3–5%. If your numbers lag, examine your signup process for unnecessary friction.
- Activation rate measures how many users hit a key milestone, like engaging with core features. This rate is calculated as:
(Number of users reaching activation milestone / Total signups) × 100.
For example, engaging with three or more core features can increase conversion rates by 74%. - In sales-led funnels, the MQL-to-SQL conversion rate is a common bottleneck. On average, this rate falls between 15% and 21%, but inbound leads tend to convert at higher rates (40–55%) compared to outbound leads (20–35%). As Taylor Bartlett from Wonderflow explains, clearly defining what makes an MQL is key to optimizing this step.
- Sales cycle length and lead response time track how quickly deals progress. If prospects are stuck in one stage for too long, your customer acquisition cost (CAC) can spike, hurting cash flow.
Conversion and Retention Metrics
At the bottom of the funnel, the focus shifts to revenue generation and customer loyalty.
- Trial-to-paid conversion rate, calculated as:
(Number of paid conversions / Number of trial users) × 100,
is a critical metric. The SaaS industry median is around 14%, with top performers exceeding 25%. Even a 1% improvement here can lead to a 7% boost in annual recurring revenue (ARR). If trial signups are high but conversions are low, your onboarding process may need refinement. - Average Revenue Per User (ARPU), found by dividing Monthly Recurring Revenue (MRR) by the total number of paying users, shows the value each customer brings. Pair this with Customer Lifetime Value (LTV) - calculated as ARPU divided by Customer Churn Rate - to gauge long-term profitability. A healthy SaaS business should aim for an LTV-to-CAC ratio of at least 3:1.
- Churn rate, calculated as:
(Number of lost customers during a period / Total customers at the start of the period) × 100,
measures retention. For enterprise SaaS, an annual churn rate between 5–7% is ideal, while monthly churn rates should stay under 5%. Notably, 43% of qualified leads drop off during the trial-to-subscription phase, so reducing friction here is crucial.
The table below summarizes the core objectives and metrics for each funnel stage:
| Funnel Stage | Primary Objective | Key Metrics |
|---|---|---|
| Awareness | Brand recognition & reach | Website traffic, CTR, Social reach, CPL |
| Evaluation | Value demonstration & intent | Trial signups, Activation rate, MQL/SQL, Sales cycle length |
| Conversion | Revenue & commitment | Trial-to-paid rate, ARPU, MRR, Win rate |
| Retention | Long-term value & loyalty | Churn rate, LTV, Expansion MRR |
"SaaS companies with predictable conversion metrics can forecast revenue with up to 85% more accuracy." – McKinsey & Company
To make the most of these metrics, start with your revenue goals and work backward to identify the key drivers.
How to Identify Bottlenecks and Drop-Off Points
After tracking your funnel metrics, the next challenge is figuring out where users are leaving - and why. For most SaaS funnels, only 3% to 10% of prospects complete the desired action. Pinpointing where qualified users abandon the process can lead to major revenue gains. Companies that tackle these drop-off points effectively have seen revenue boosts of 15–30%, all without needing additional traffic.
Using Funnel Visualizations
Funnel visualizations are a powerful way to see how users drop off at each stage. Look for two key patterns: "sudden cliffs", which may indicate critical issues like technical glitches, and "gradual declines", which often point to smaller friction points.
To locate bottlenecks, calculate stage-to-step conversion rates using this formula: (Current Stage Users / Previous Stage Users) × 100. This will reveal where users are getting stuck. For instance, SaaS Academy noticed a sharp drop-off between scheduling and attending demo calls. By introducing automated SMS reminders an hour before demos, they cut no-shows by 20% and added $90,000 in monthly revenue.
Keep your funnel stages manageable - ideally 4–6 stages. Too many can create noise, while too few might hide important issues. Also, double-check your tracking setup to ensure there are no errors like event duplication or identity mismatches that could skew your data.
"The biggest percentage drop can be a healthy filter step, a tracking leak, or a segment mix shift. Treat it as a lead, not a verdict." – Roman Mohren, CEO, FullSession
Focus on "actionable drop-offs" - those that are large enough to matter, stable enough to trust, and tied closely to your key metrics. Combine your funnel data with qualitative tools like session replays, heatmaps, or "rage click" tracking to understand why users drop off, not just where. For example, Bunzl used VWO to analyze their checkout funnel and discovered a major drop-off just before checkout. By refining the checkout process, they achieved a 9% boost in overall sales and a 9.5% increase in click-throughs to checkout.
Once you identify these problem areas, dig deeper to understand which user segments are most impacted.
Segmenting Data for Deeper Insights
Not all drop-offs are created equal. Segmenting your data can reveal whether an issue affects everyone or just specific groups. Break down your metrics by:
- Acquisition channel (e.g., paid search, direct traffic, partnerships)
- User persona (e.g., job title, company size, industry)
- Device and environment (e.g., mobile vs. desktop, browser type)
- Cohort vintage (e.g., sign-ups from this week vs. last month)
For example, if a drop-off is concentrated on one browser, it could indicate a technical issue specific to that environment. Or, if one acquisition channel has poor conversion rates, there might be a mismatch between your landing page messaging and the actual product experience. Here's a quick reference table for diagnosing common drop-off signals:
| Drop-off Signal | Likely Cause | Recommended Action |
|---|---|---|
| Sudden "cliff" after a release | Tracking/versioning error or UI regression | Compare cohorts before/after release; fix instrumentation |
| Drop concentrated on one browser | Environment-specific technical bug | Segment by device/browser; check for errors or latency |
| High time-to-next-step | Confusion, gating, or slow loading | Watch session replays; simplify UI or speed up actions |
| Drop-off for specific channel | Audience or expectation mismatch | Review landing page promise vs. in-app reality |
| Drop correlates with errors | Reliability/Technical failure | Segment by "error-seen"; fix top error clusters |
Behavioral segmentation is another effective tool. Compare "Power Users" with churned users to identify the paths and features that drive retention. Kommunicate used this strategy to address low feature adoption in their activation funnel. By adding a guided product walkthrough, they saw a 37.5% increase in feature adoption and a 3% boost in expansion MRR within seven months.
"Most teams do not fail at finding drop-offs. They fail at deciding what the drop-off means, what is worth fixing first, and whether the fix actually caused the lift." – Roman Mohren, CEO, FullSession
How to Optimize Your Funnel Through Testing
Once you've identified where users drop off in your funnel, the next step is to improve it through focused testing. Businesses that adopt a structured approach to funnel testing often achieve 20–30% increases in conversion rates within six months. However, only 1 in 7 A/B tests results in a winning variation. The trick is to prioritize impactful changes and execute tests correctly.
A/B Testing for High-Impact Changes
In B2B SaaS, making structural adjustments yields better results than superficial tweaks. For example, testing your value proposition, form fields, or pricing strategy is far more effective than simply changing button colors. A strong hypothesis is essential and should follow this format: "If we [change], then [metric] will [increase/decrease] because [rationale based on data]".
Stick to testing one variable at a time to clearly identify what drives results. Each page should have a single primary goal and one clear call-to-action (CTA) to reduce decision fatigue. For instance, if you're testing a landing page, adjust either the headline or the CTA placement - never both at once. This approach ensures you can pinpoint the exact change that worked.
Run tests for at least two business cycles (typically 2–4 weeks) to account for weekday and weekend variations. Ending tests prematurely increases the chance of a false positive by up to 70%. Keep an eye on guardrail metrics like lead quality and refund rates to ensure your "wins" are sustainable. A test that boosts signups but harms downstream revenue isn't a true success.
"True experiments should be running a minimum of 2 business cycles, regardless of how many variations." – Shiva Manjunath, Experimentation Manager, Solo Brands
Before diving into design changes, address the basics like page speed and technical issues. A website that loads in 1 second can have a conversion rate 3x higher than one that takes 5 seconds. Also, calculate the required sample size beforehand - running a test without enough traffic wastes time and resources.
Once your tests yield insights, use a structured system to prioritize optimizations.
How to Prioritize Funnel Optimizations
Focus on bottlenecks that have the highest potential for improvement. Use test results to zero in on changes that make a noticeable difference. The ICE Framework can help you rank potential tests: score each idea from 1–10 based on Impact (potential lift), Confidence (likelihood of success), and Ease (effort required). Start with high-scoring tests to get the most out of your efforts.
Aim for changes that could lead to 15–25% improvements, as smaller tweaks (2–5%) demand much more traffic to achieve statistical significance. Here's a quick guide to prioritizing test elements:
| Test Element | Impact Level | Key Metric |
|---|---|---|
| Value Proposition | High | Conversion Rate / SQLs |
| Form Fields | High | Form Completion Rate |
| Pricing Architecture | High | Trial-to-Paid / ARPU |
| Social Proof | Medium | Trust / Engagement |
| Button Color | Low | Click-Through Rate |
Start by addressing your biggest bottleneck - the stage with the steepest drop-off or longest delay. For example, reducing form fields from four to three can increase conversions by 50%. If trial-to-paid conversion is a key issue, test strategies like offering money-back guarantees or extending trial periods. Always segment results by device (mobile vs. desktop) and traffic source, as a winning variation on desktop might fail on mobile.
Using Mentorship to Improve Funnel Analysis
Funnel analysis isn’t just about collecting data - it’s about taking meaningful action. Yet, many B2B SaaS companies don’t even have a documented funnel strategy. And here’s a telling stat: 60% of marketing optimization hypotheses fail to improve conversion when tested without a data-driven approach. That’s where expert mentorship can make a real difference, bridging the gap between raw data and smart decision-making.
How Mentorship Drives Better Results
Mentorship adds a layer of clarity to the process of mapping and testing your funnel. A good mentor doesn’t just help you interpret metrics - they help you turn them into actionable strategies. While your analytics might reveal where users drop off, a mentor helps you figure out why they’re leaving and which issues to address first. Nick Schwinghamer, Former Director of Growth, Operations, and Partnerships at Shopify, puts it perfectly:
"A funnel gives you a logical way to track and analyze the performance of key stages of your user journey so you can determine what's working and what's not... It helps you turn data into insight, and insight into action."
Mentors also help you avoid common pitfalls, like focusing too much on the wrong stage or getting lost in irrelevant metrics. Instead of tracking dozens of KPIs, they’ll steer you toward the 1-2 core metrics per stage that truly impact your business.
Expert Guidance with Stackd
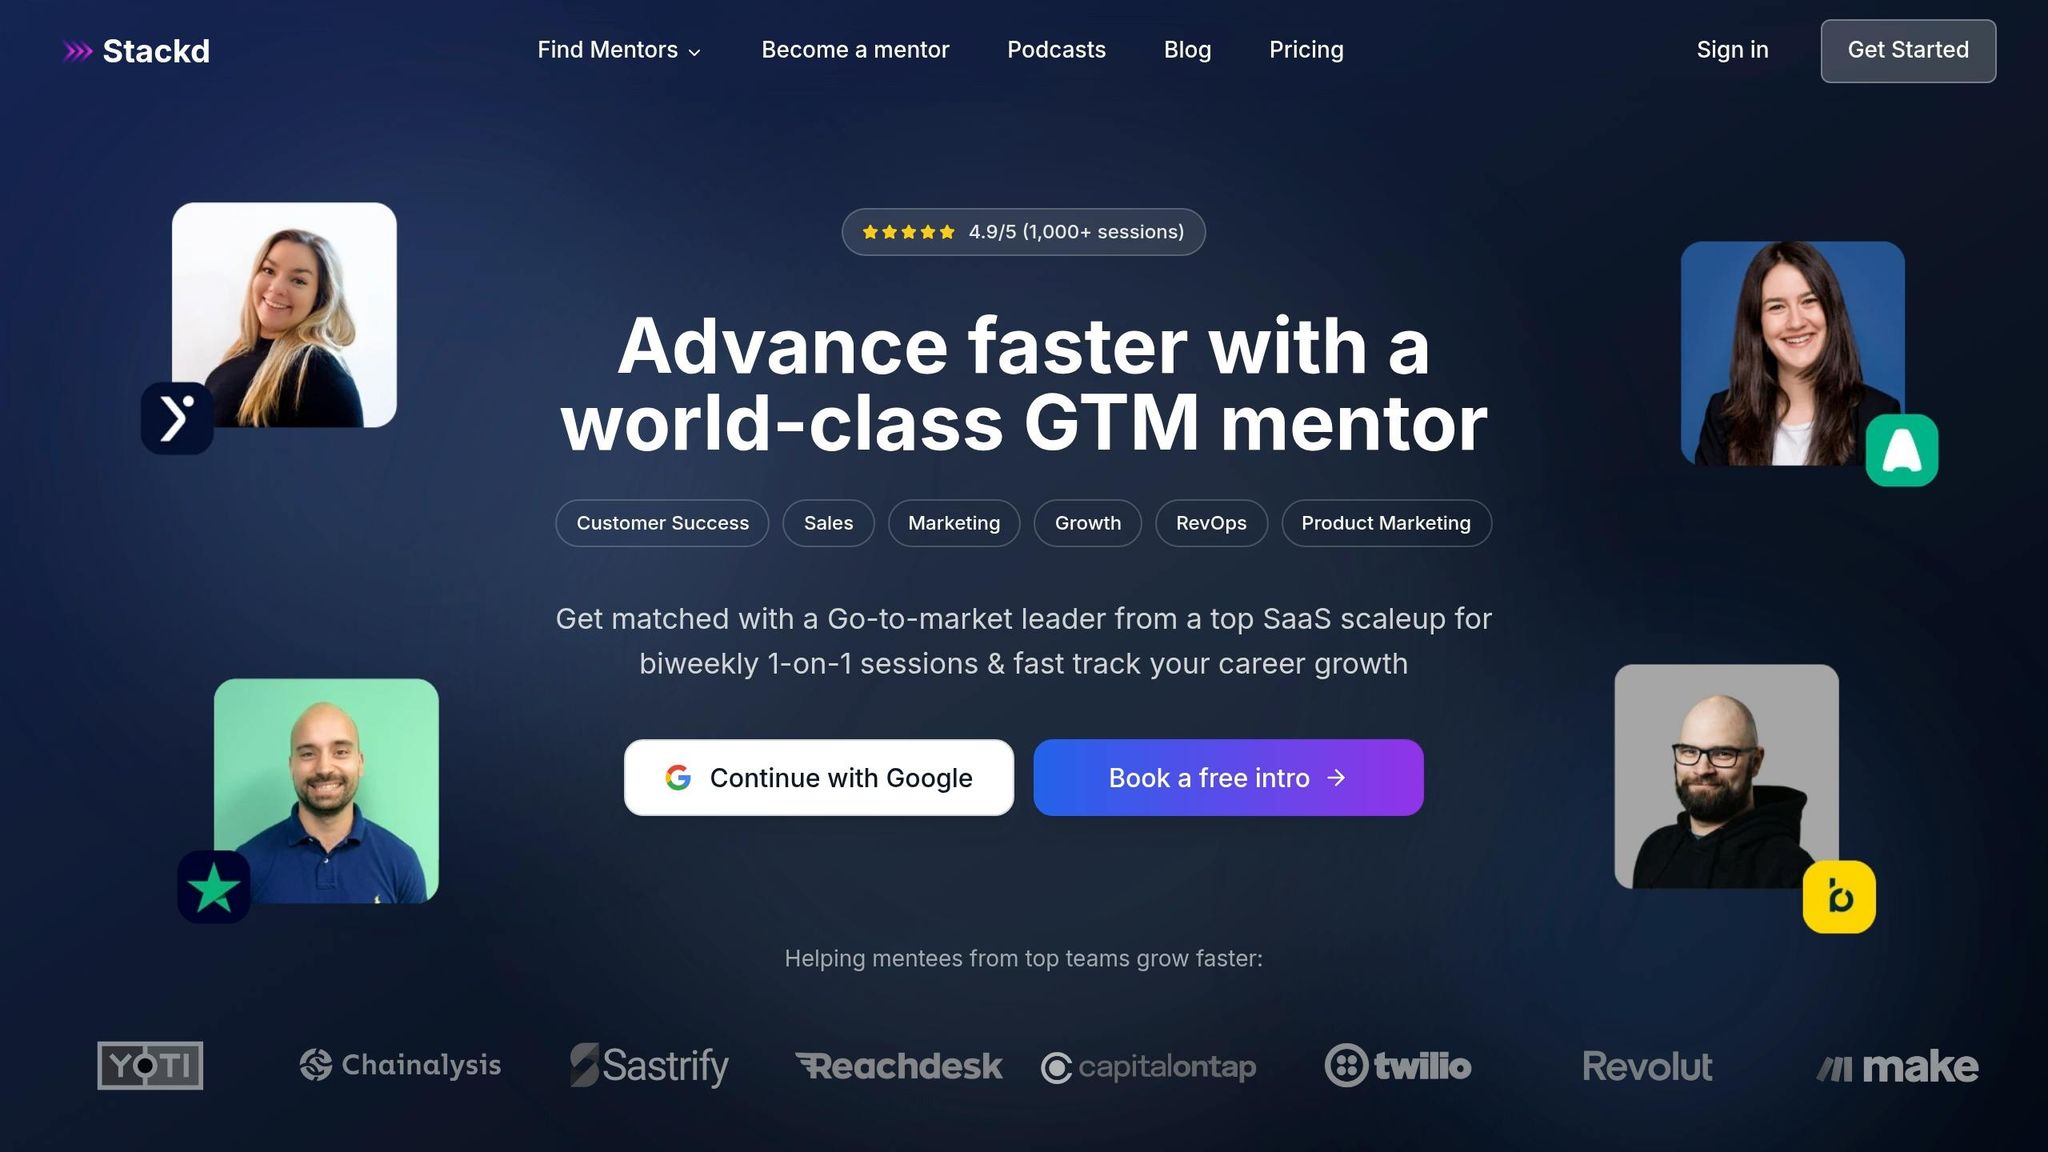
Stackd connects you with experienced Go-to-Market leaders from top SaaS companies who’ve already faced and solved the challenges you’re dealing with. Through personalized 1-on-1 sessions, mentors help you build a hypothesis roadmap, analyze segmented data for insights, and prioritize the tests that will have the biggest impact. These aren’t cookie-cutter tips - sessions focus on your actual funnel data.
Whether you’re struggling with activation rates, trial conversions, or aligning your team on growth priorities, Stackd’s mentors share proven frameworks and strategies that companies with 30-50% better conversion rates rely on. You can even start with a free 30-minute trial session to see how mentorship can level up your funnel analysis. With expert guidance, your data becomes more than just numbers - it becomes a roadmap for action.
Conclusion
Summary of Key Steps
SaaS funnel analysis is a continuous effort that fuels growth. Begin by mapping your user journey, clearly defining the entry and exit points for each stage - from Awareness to Retention. Accurate tracking is essential because unreliable data can derail your tests. Next, focus on tracking meaningful metrics like conversion rates, funnel velocity, and efficiency markers such as CAC (Customer Acquisition Cost) and LTV (Lifetime Value).
Leverage funnel visualizations to spot the most significant bottlenecks, particularly in the trial-to-paid stage, where 43% of qualified leads often drop off. Dive deeper by segmenting your data based on user type, acquisition channels, and behavior to uncover hidden patterns. Once you've identified the leaks, conduct targeted A/B tests on crucial areas like onboarding processes or pricing pages. This highlights the importance of a data-driven approach since many optimization efforts fall short without it.
Lastly, consider the value of expert mentorship to speed up your progress. With many B2B SaaS companies lacking a documented funnel strategy, guidance from seasoned professionals can help you avoid pitfalls and zero in on strategies that deliver results.
These insights provide a strong foundation for taking meaningful action.
Next Steps
To build on these steps, start by evaluating your current funnel. Map the user journey, identify the stage with the largest drop-off, and ensure your tracking systems are airtight. Even a simple, one-page strategy outline can be a great starting point. Then, prioritize a single high-impact test where you're losing the most revenue potential.
If you’re looking for extra support, consider booking a free 30-minute session with Stackd. This can help you uncover blind spots and create a clear, actionable roadmap for testing. Remember, funnel data only drives results when you take action - so don’t wait to get started.
FAQs
What should my SaaS funnel stages be?
The SaaS funnel is a journey that guides potential customers from discovering your product to becoming loyal advocates. Here's how it typically breaks down:
- Awareness: This is where you grab attention. Marketing efforts like ads, blog posts, or social media campaigns help introduce your product to potential customers.
- Interest: Once you've caught their eye, it's time to keep them engaged. This stage often involves offering valuable content, free trials, or product demos to spark curiosity.
- Consideration: Here, prospects take a closer look. They might explore your onboarding process, attend webinars, or dive deeper into how your product solves their problems.
- Conversion: The goal here is to turn interested prospects into paying customers. This stage often involves closing the deal through compelling offers or a seamless checkout experience.
- Retention: Keeping customers happy is just as important as gaining them. Ongoing support, updates, and engagement help ensure they stick around.
- Advocacy: Happy customers become your best promoters. They may leave glowing reviews, recommend your product to others, or even become brand ambassadors.
Each of these stages plays a critical role in driving growth. By carefully tracking and refining each step, you can boost conversions and build stronger customer relationships.
Which events should I track to measure activation?
To gauge activation, focus on tracking events that indicate users have experienced the core value of your product and are likely to stick around. These key events might include actions like setting up the product, connecting data, inviting teammates, completing workflows, or reaching specific, measurable outcomes.
It's also helpful to monitor milestones throughout your onboarding process. These checkpoints can reveal when users are fully engaged and successfully activated.
How do I choose the first funnel bottleneck to fix?
Take a close look at your SaaS conversion funnel to pinpoint where users are dropping off the most or where conversion rates are the weakest. This stage should be your starting point for improvements. Why? Because tackling the biggest roadblock often leads to the most noticeable results.
Before diving in, double-check that the issue is real and not just a measurement glitch. Once confirmed, weigh the effort needed to fix the problem against the potential payoff. This ensures you're focusing your resources on changes that will make the biggest difference.